
ICIMS Dashboard Design Series (3/3): Simplify for Speed, and Don’t Be Afraid of Emojis 😉
Keep It Simple, and Fast
When I think about the difference between a usable dashboard and a great one, it comes down to one idea: simplify for speed.
Use fewer words. Fewer panels. Shorter names. Whatever helps the user process what they’re looking at fast.
And yes, emojis belong in your dashboards.
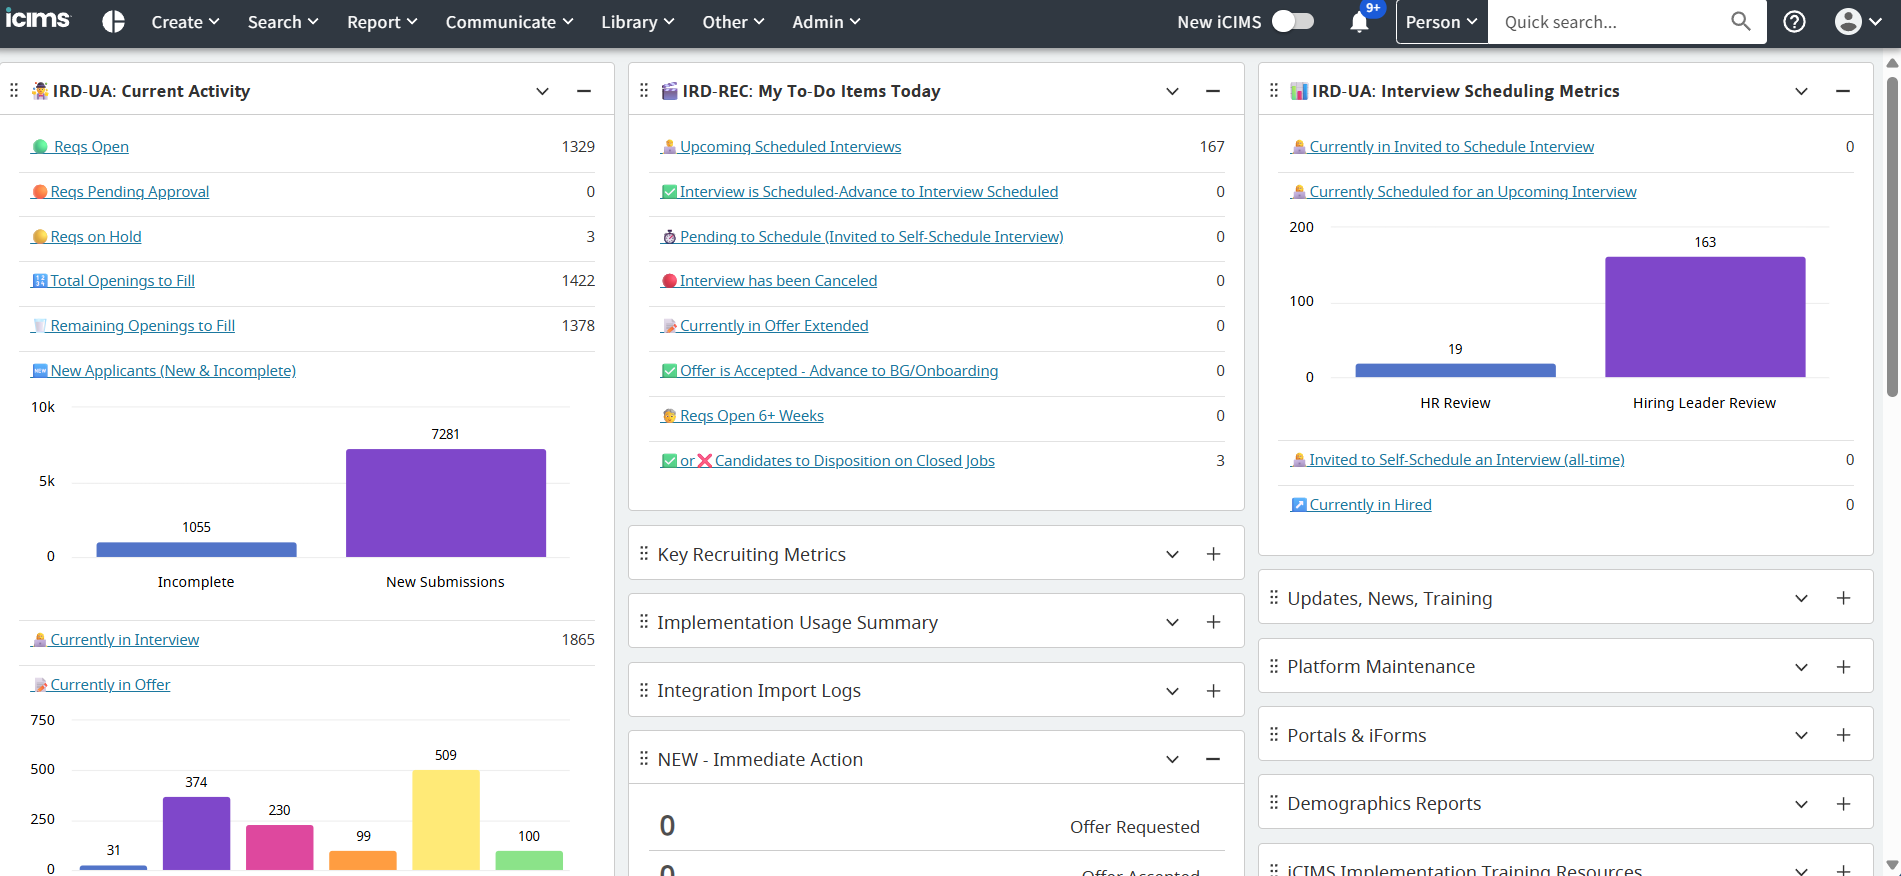
The Emoji System I Rely On
We’re visual creatures. Symbols register faster than text. And when used intentionally, emojis can streamline navigation, call attention to key items, and even make the work feel more human.
Here are a few of my go-tos:
-
🔴 Red Circle = Needs attention now
-
🟡 Yellow Circle = Pending or in-progress
-
✅ Green Check = Approved or completed
-
❌ Red X = Closed or rejected
-
📊 Bar Chart = Visual or trend report
-
💰 Money Bag = Bonus-eligible hires
-
⭐️ Star = New hire or top performer
-
🆕 “New” = Recently added
-
⏳ Hourglass or ⏱️ Stopwatch = Time-sensitive
-
➡️ Arrow Right = Preboarding or next step
Power of the Reporting Center
One way I apply this thinking is with the Reporting Center dashboard. This secondary dashboard is a great place to house reports that are important, but not urgent. Think source-of-hire analytics, weekly application volume, or performance trends. That keeps your main dashboard clean and focused while giving your team somewhere to go when they need to zoom out.
And yes, you can embed other tools there too. IRD has embedded full Power BI dashboards and third-party widgets using iframe codes. The experience is seamless and it keeps users anchored inside ICIMS.
The layout options in ICIMS dashboards also let you design for the right moment. If you’re embedding a chart or app, go with a single-column layout so the embedded tool gets the space it needs. If you’re creating a set of smaller action panels, a 2- or 3-column view can keep it tight and scannable.
Closing Thought
At the end of the day, dashboard design is about care. It’s about imagining what someone else needs, and building for their brain, not yours.
If you’re working on this and feeling stuck, I’m always happy to help. And if you’re part of SAI, you already know: we’re building better dashboards together every week.
👉 You can watch the full conversation here:
Want more insights like these?
System Admin Insights is a community for the people who make HR technology work. Learn more at systemadmininsights.com.